9. Basic Interactive Plot Example
Requires wrf-python and ipywidgets
%matplotlib inline

import matplotlib.pyplot as plt

import numpy as np
from datetime import datetime
from netCDF4 import Dataset
from wrf import getvar, interplevel, ALL_TIMES
from ipywidgets import interactive
---------------------------------------------------------------------------
ModuleNotFoundError                       Traceback (most recent call last)
<ipython-input-1-7a5518a6085b> in <module>
      5 import numpy as np
      6 from datetime import datetime
----> 7 from netCDF4 import Dataset
      8 from wrf import getvar, interplevel, ALL_TIMES
      9 from ipywidgets import interactive

ModuleNotFoundError: No module named 'netCDF4'
# Open a netCDF data file using xarray default engine and load the data into xarrays

path = '/expanse/lustre/projects/uic406/snesbitt/em_quarter_ss/mp10/'

ncfile = Dataset('wrfout_d01_0001-01-01_00:00:00')

# Extract slices of lon and lat
# Read in data from netCDF file.
# Note that when we extract ``u`` and ``v`` from the file,

# Extract the Geopotential Height and wind fields
z = getvar(ncfile, "z", timeidx = ALL_TIMES)
ua = getvar(ncfile, "ua", timeidx = ALL_TIMES)
va = getvar(ncfile, "va", timeidx = ALL_TIMES)
wa = getvar(ncfile, "wa", timeidx = ALL_TIMES)
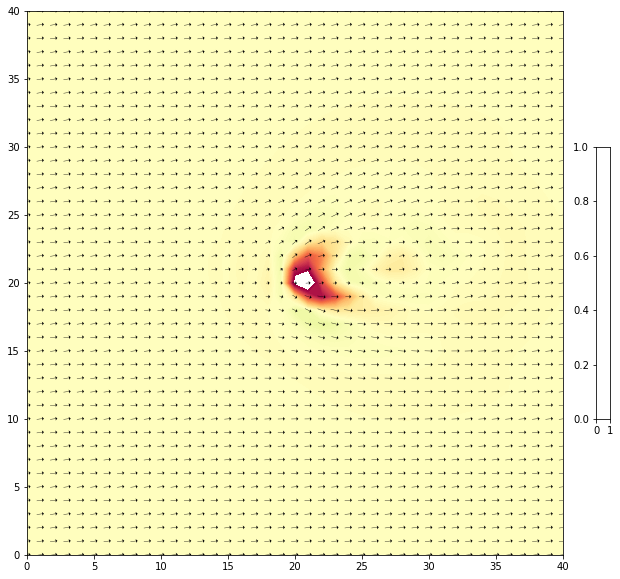
def plot_interact(tindex, level):
    ua_interp = interplevel(ua, z, level)
    va_interp = interplevel(va, z, level)
    wa_interp = interplevel(wa, z, level)

    fig1, ax1 = plt.subplots(figsize=(12, 10))

    cb = ax1.contourf(z['west_east'].values,
                   z['south_north'].values,
               wa_interp.isel(Time=tindex).values,levels=np.arange(-30,30,0.5),cmap='Spectral_r')

    Q = ax1.quiver(z['west_east'].values,
                   z['south_north'].values,
                   ua_interp.isel(Time=tindex).values,
                   va_interp.isel(Time=tindex).values,pivot='middle',color='black',
                   units='width',width=0.0007,headwidth=10)

    qk = ax1.quiverkey(Q, 0.92, .95, 5, r'$5 \frac{m}{s}$', labelpos='E',
                       coordinates='figure')

    cb = plt.colorbar(cb, shrink=0.5, title='Vertical wind (m/s)')

    ax1.set_title('Vertical motion (m/s) and winds (m/s) at time='+str(tindex)+' and level='+str(level))

    plt.tight_layout()
    plt.show()

interactive_plot = interactive(plot_interact, tindex=(0, 13), level=(0, 20000, 500))
output = interactive_plot.children[-1]
output.layout.height = '500px'
interactive_plot
plt.quiver(x,ua_interp.values, va_interp.values)
---------------------------------------------------------------------------
ValueError                                Traceback (most recent call last)
<ipython-input-34-aa70d6a631e3> in <module>
----> 1 plt.quiver(np.arange(40),np.arange(40),ua_interp.values, va_interp.values)

~/miniforge3/envs/py3/lib/python3.8/site-packages/matplotlib/pyplot.py in quiver(data, *args, **kw)
   2869 @_copy_docstring_and_deprecators(Axes.quiver)
   2870 def quiver(*args, data=None, **kw):
-> 2871     __ret = gca().quiver(
   2872         *args, **({"data": data} if data is not None else {}), **kw)
   2873     sci(__ret)

~/miniforge3/envs/py3/lib/python3.8/site-packages/matplotlib/__init__.py in inner(ax, data, *args, **kwargs)
   1445     def inner(ax, *args, data=None, **kwargs):
   1446         if data is None:
-> 1447             return func(ax, *map(sanitize_sequence, args), **kwargs)
   1448
   1449         bound = new_sig.bind(ax, *args, **kwargs)

~/miniforge3/envs/py3/lib/python3.8/site-packages/matplotlib/axes/_axes.py in quiver(self, *args, **kw)
   5019         args = self._quiver_units(args, kw)
   5020
-> 5021         q = mquiver.Quiver(self, *args, **kw)
   5022
   5023         self.add_collection(q, autolim=True)

~/miniforge3/envs/py3/lib/python3.8/site-packages/matplotlib/quiver.py in __init__(self, ax, scale, headwidth, headlength, headaxislength, minshaft, minlength, units, scale_units, angles, width, color, pivot, *args, **kw)
    501                                              **kw)
    502         self.polykw = kw
--> 503         self.set_UVC(U, V, C)
    504         self._initialized = False
    505

~/miniforge3/envs/py3/lib/python3.8/site-packages/matplotlib/quiver.py in set_UVC(self, U, V, C)
    574         for name, var in zip(('U', 'V', 'C'), (U, V, C)):
    575             if not (var is None or var.size == self.N or var.size == 1):
--> 576                 raise ValueError(f'Argument {name} has a size {var.size}'
    577                                  f' which does not match {self.N},'
    578                                  ' the number of arrow positions')

ValueError: Argument U has a size 1681 which does not match 40, the number of arrow positions
x,y = np.meshgrid(z.west_east.values,z.south_north.values)
x
array([[ 0,  1,  2, ..., 38, 39, 40],
       [ 0,  1,  2, ..., 38, 39, 40],
       [ 0,  1,  2, ..., 38, 39, 40],
       ...,
       [ 0,  1,  2, ..., 38, 39, 40],
       [ 0,  1,  2, ..., 38, 39, 40],
       [ 0,  1,  2, ..., 38, 39, 40]])
y
array([[ 0,  0,  0, ...,  0,  0,  0],
       [ 1,  1,  1, ...,  1,  1,  1],
       [ 2,  2,  2, ...,  2,  2,  2],
       ...,
       [38, 38, 38, ..., 38, 38, 38],
       [39, 39, 39, ..., 39, 39, 39],
       [40, 40, 40, ..., 40, 40, 40]])